Core Applications

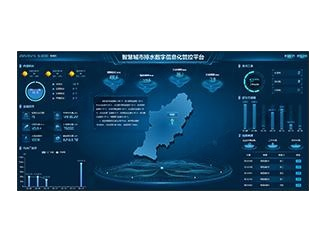
● Integrate massive amounts of data to create a multi-functional, multi-element dashboard that enables business linkage, real-time monitoring, and auxiliary decision-making.
● Core indicators such as the number of waterlogging points, enterprise sewage discharge volume, operation load of sewage treatment plants, and work order completion rate are clearly visible at a glance.
● Data is updated in real time dynamically, helping managers grasp the overall situation on a single screen and make decisions one step ahead.
Displayed from 5 dimensions: rainfall, waterlogging points, pipe networks, pump stations, and rivers.
● When heavy rains hit, it analyzes waterlogging patterns by combining historical data and provides real-time early warnings.
● Based on pipe network water levels and flow rates, it predicts waterlogging risks in a trending manner and links with the scheduling of waterlogging drainage pump stations.
● Transforming from "being at the mercy of the weather" to "precision defense", it prevents cities from turning into "inland seas"
● Enterprise sewage discharge monitoring: Aggregate the flow, water quality, and total discharge of sewage outlets, with automatic alarms for exceeding standards. Clearly display the annual sewage discharge and remaining quotas, leaving no room for illegal discharge.
● Pipe network health tracking: Dynamically monitor the flow, water level, and siltation of rainwater and sewage pipe networks.
● Intelligent pump station regulation: Automatically start and stop water pumps according to the pipe network load to reduce energy consumption.
● Visual display of the entire sewage treatment process through process configuration
● Aggregated display of operating data at key nodes and on/off status of treatment equipment
● Get a clear picture of the "family assets" and establish digital archives. Each section of the pipeline is marked, with records of asset service life and the entire maintenance process, making underground projects transparent.
● By arbitrarily selecting an area on the map, all assets within the selected range will be displayed. It can also predict maintenance needs, extend the service life of equipment, and lay a solid foundation for refined management.
● When the water level at a waterlogging point exceeds the threshold, it intelligently matches maintenance teams and links emergency rescue vehicles and personnel.
● GIS maps displays the real-time locations of waterlogging points and emergency rescue vehicles, with full-process GPS tracking.
● Based on the inspection plan, it automatically formulates inspection tasks and routes.
● It enables "on-the-go checking" of drainage facilities and "real-time diagnosis" of their operation status.
● The mobile APP supports clock-in and abnormal situation reporting anytime and anywhere.


.png)
.png)


