Platform Functions:
1. BI Cockpit – Hierarchical Management and Refined Design
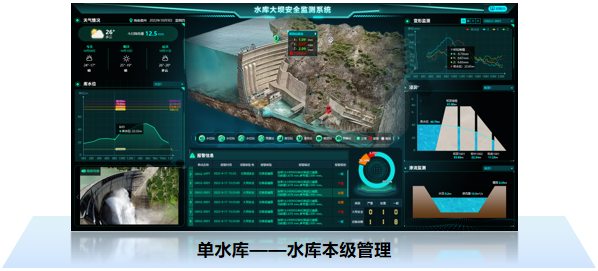
Overview of the location distribution and operation status of all reservoirs in the jurisdiction.The operation status of reservoirs is clearly visible at a glance.Aggregate early warning information of all reservoirs to keep track of abnormal situations in real time.Intuitively display the phreatic line section model, and curve analysis of deformation, seepage, and water level data trends.Intelligently classify and grade alarm information to assist in formulating flood control and drought relief command decisions.Aggregate early warning information to remind administrators to handle them promptly.

2.Rainfall and Water Regime Monitoring
Water regime monitoring: Generate daily, monthly, annual, and designated period water level process curves for each monitoring station, compare them with dead water level, flood limit level, flood control high water level, and flood level. When the water level exceeds the limit, activate alarms of different levels.Rainfall monitoring: Count instantaneous rainfall, hourly rainfall, and daily accumulated rainfall in the reservoir area, sort out and analyze them to understand the temporal and spatial distribution characteristics and variation rules of rainfall, and predict its trends and impacts.

3.Dam Safety Monitoring
Automatically generate data process curves for dam displacement, deformation, seepage pressure, and seepage. The data model is simple and clear, enabling tracking of subtle changes in dam safety values, analysis of the stability of the dam body and slope, judgment of the operation status of anti-seepage, drainage, and filter facilities, and diagnosis of the reservoir area's health condition.

4.Video Surveillance
Through cameras installed at key locations such as the reservoir dam crest, spillway, and water release culvert, real-time monitoring of the reservoir's rainfall and water regime, sluice gate operations, and the surrounding environment of the dam is conducted. Immediate on-site inspection is triggered when abnormalities occur.
5.Early Warning and Alarm
Based on the results of comprehensive analysis of historical data, early warning and alarm thresholds are set. The system issues early warnings in advance when data exceeds the limits. When abnormal phenomena are confirmed, the frequency of monitoring and alarming is proactively increased.
6.Inspection Management
Tasks such as daily inspections and flood control patrols are assigned, and inspection routes are automatically generated. Meanwhile, manual inspection data can be entered manually to verify the accuracy of automatically monitored data.
7. Seamless Connection with Provincial Platform
Monitoring data is accessed to the provincial supervision platform via OPC/database/WebService.


.png)
.png)


